


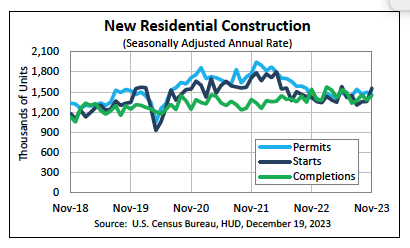
US Single-family Housing Starts Climb 18% in November
Permits and completions slide for month.
The U.S. Census Bureau and the U.S. Department of Housing and Urban Development jointly announced the following new residential construction statistics for November 2023:
Building Permits
Privately‐owned housing units authorized by building permits in November were at a seasonally adjusted annual rate of 1,460,000. This is 2.5 percent below the revised October rate of 1,498,000, but is 4.1 percent above the November 2022 rate of 1,402,000.
Single‐family authorizations in November were at a rate of 976,000; this is 0.7 percent above the revised October figure of 969,000. Authorizations of units in buildings with five units or more were at a rate of 435,000 in November.
Housing Starts
Privately‐owned housing starts in November were at a seasonally adjusted annual rate of 1,560,000. This is 14.8 percent (±14.0 percent) above the revised October estimate of 1,359,000 and is 9.3 percent (±14.6 percent)* above the November 2022 rate of 1,427,000.
Single‐family housing starts in November were at a rate of 1,143,000; this is 18.0 percent (±12.9 percent) above the revised October figure of 969,000. The November rate for units in buildings with five units or more was 404,000.
Housing Completions
Privately‐owned housing completions in November were at a seasonally adjusted annual rate of 1,447,000. This is 5.0 percent (±15.1 percent)* above the revised October estimate of 1,378,000, but is 6.2 percent (±15.2 percent)* below the November 2022 rate of 1,543,000.
Single‐family housing completions in November were at a rate of 960,000; this is 3.2 percent (±13.2 percent)* below the revised October rate of 992,000. The November rate for units in buildings with five units or more was 472,000.
CONTRACTOR SUPPLY MAGAZINE


The April/May 2024 issue of Contractor Supply magazine is here!
This digital edition is sponsored by BECK AMERICA Inc.
Our cover story, Masters of Fasteners, visits Interstate Screw Corp. of metro Miami, which serves the fastening needs of south Florida, the Caribbean and Central and South America.
Also in this issue,our Industry Updates cover Adhesives, Tapes and Sealants, Anchoring Systems and Safety and PPE.
This digital edition is fully searchable and contains live links to every advertiser and new product listing. Click away!